Sony VTC6 18650 cell
The SONY VTC6 18650 3000mAh cell
From Mooch
This is an great underrated cell that I am rating at 19A/3000mAh. The datasheet lists the max continuous current at 30A but that's only if you stop the discharge when the cell reaches 80°C, way before a continuous discharge has finished. The true continuous current rating from Sony is 15A. But at that current level the temperature is 72°C, about 6°C-9°C cooler than other batteries at their rating. This is why I feel it is underrated, like the Samsung 30Q, and why I have given it a 19A rating. It runs at a slightly higher voltage than both the 30Q and HG2 though.
The 18650 ratings table has been updated to include this cell.
A shootout between the HG2, 30Q, and VTC6 is now underway to see which is the best-performing 3000mAh and whether the ratings for the 30Q and/or HG2 need to be adjusted.
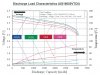
Continuous-Current Test Results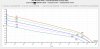
Pulsed-Current Test Results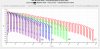
VTC6 Ratings
Comments
- At 10A continuous it reached 2875mAh. This is great performance for 3000mAh cell at 10A so I am rating this cell at 3000mAh.
- At 15A continuous the temperature rose to 72°C. This is a few degrees below the average temperature of a cell running at its continuous discharge rating (CDR).
- At 20A continuous the temperature rose to 82°C. This is just a bit above the average temperature of a cell running at its CDR but within an acceptable range and is an indication that we are near the cell's true rating.
- At 25A continuous the temperature rose to 98°C. This is a ridiculously high temperature and a strong sign that we're way above the cell's true rating.
- I am setting a CDR of 19A for this cell. Operating at that level would bring the temperature near to the average for a cell operating at its CDR. While operating any cell near its rated maximum current level causes damage to the cell, I would expect decent cycle life from this cell at 19A continuous.
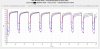
- I have included pulsed discharges but I haven't set pass/fail standards for pulse testing yet. The discharges were done at 5sec on/30sec off, down to 2.5V. One chart shows the entire discharge at each level. The other chart is zoomed in to show the first 5 minutes to make it easier to see the voltage sag at different current levels.
We Also Recommend